Search
close
Stay in the loop with our monthly newsletter, bringing you a fresh take on all things property.
Form funnels into a Pardot list to update Prospect sign up for Estate Agent and New Homes
"*" indicates required fields
Annual rental inflation for new lets, UK
Enquiries per rented home - more than double pre pandemic
Postal areas registering 10%+ rental inflation
“The unaffordability of home ownership will continue to support strong demand for renting into 2025, and any policy changes that reduce supply will simply push rents higher - hitting low incomes renters hardest. It’s vital that policy makers in Government focus on growing the stock of homes for rent."
Annual UK rental inflation for new lets has slowed to 5.4%, close to half the rate a year ago (10.2%), and the lowest for almost 3 years.
Rents are experiencing a more drawn-out slowdown compared to consumer prices and earnings. A sustained mismatch between supply and demand is keeping an upward pressure on rents, especially in more affordable locations. Slower growth is focused on larger cities where affordability pressures are limiting what renters can pay, pushing up rents in adjacent markets.
A scarcity of supply has been an ongoing feature of the rental market for the last 3 years.
The number of homes for rent is 18% higher than a year ago as lower mortgage rates enable some renters to exit the rental market to buy homes. However, the number of homes for rent remains a quarter (24%) below the pre-pandemic average, limiting choice for renters.
There has been a steady flow of landlords selling for the last few years. The number of formerly rented homes for sale has increased slightly in July to 12.5% of all homes for sale. Speculation over possible tax changes impacting landlords in the Budget could well result in an increase in landlord sales this autumn, but much depends on the timing of any potential tax changes.
Any economic or policy changes that lead to further erosion in the stock of rented homes will simply sustain rental growth in the near term. In the absence of more rental supply, growing affordability constraints will be the only factor slowing rent rises, a trend already impacting low-income renters who are having to make compromises.
Demand for renting has cooled over 2024 but remains high by pre-pandemic standards. The chart below shows the number of enquiries per rented home each month over the last five years.
The post-pandemic period saw demand for rented homes rising to record high levels, which, together with falling supply, pushed rents higher. Rental demand started to rise quickly over H2 2021 as the economy re-opened. This accelerated over 2022 with a resumption of international travel and changes in visa rules for workers and students at a time when the UK jobs market was also strong. Two years ago, there were over 40 people chasing every home for rent.
Demand for renting was further compounded by the jump in mortgage rates over H2 2022 and 2023. This made buying more expensive, keeping would-be buyers in private rented sector and exacerbating demand.
There has been a clear step down in rental demand over 2024 as ‘one-off’ pandemic factors fall away and lower mortgage rates enable some renters to buy, freeing up homes for rent. Visa rules for students and workers have been tightened and are likely to reduce levels of net migration, although the scale of change is unclear.
The competition for rented homes is still running at 2x pre-pandemic levels. We expect demand to remain elevated into 2025 despite a softening labour market. The unaffordability of homeownership will continue to support demand for renting, especially across southern England where a sizeable proportion of workers are unable to buy. A lack of a meaningful growth in the supply of affordable housing means the private rented sector will continue to meet demand from those on lower incomes, adding to demand.
London and other major cities across the UK have been leading the slowdown in rental inflation. The UK’s largest cities have recorded some of the greatest gains in average rents, averaging over 10% per year for the last 3 years. This pace of rent rises is unsustainable and means affordability is starting to impact rental growth.
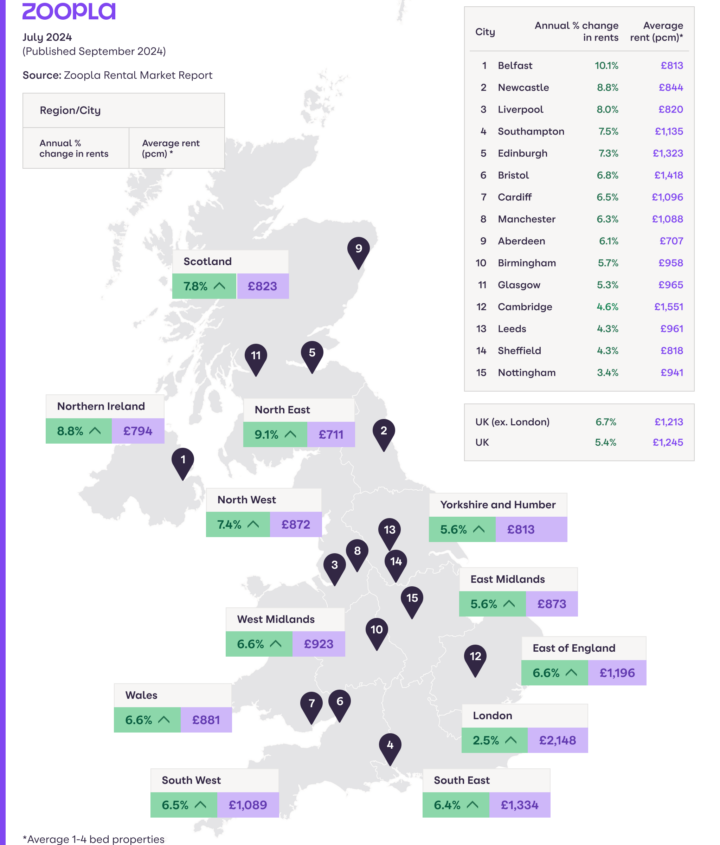
Segmenting our rental index by type of area shows the greatest slowdown has been in London, where rents are rising at just 2.5% -down from over 12% last year. Rental growth is slowing quickly across the UK’s other largest cities, the so-called ‘core cities’, with rents 5.8% higher over the last year – down from 10.7% a year ago.
Cities are major hubs of rental supply and together London and these 12 core cities account for 30% of all private rented homes (and just 13% of local authorities). The remaining 70% of rented homes are spread across other cities and towns of different sizes.
Rental inflation in these non-city areas continues to run at an above-average rate of 6.8% to 7.4% a year. This reflects demand being pushed into more affordable areas, often adjacent to larger cities which are key employment centres.
Rental inflation remains in double digits across six postal areas, which are all adjacent to large cities, led by Kilmarnock (KA, 13%) to the south-west of Glasgow and Kirkcaldy (KY, 12%) in the east of Scotland. Rent controls in Scotland have played a part in pushing rents higher. In England, rents continue to rise quickly in Wolverhampton (WV, 12%), Oldham (OL, 11%), Darlington (DL, 10%) and Walsall (WS, 10%), which are all adjacent to large cities.
Rental inflation is less than 2.5% year-on-year in South West London, West London and East London postal areas. Rents in these areas are more than double the national average, with affordability acting as a major constraint on rent rises.
The Zoopla rental index tracks rents for new lets, measuring rental growth as homes become vacant and the rent is reset to the market level. This reflects the experience of renters seeking new homes. Rents for existing tenancies will rise more slowly.
The ONS rental index is not a new lets index and tracks rental inflation across the whole private rental market i.e. covering rental inflation for existing tenancies as well as new lettings. The chart below shows how the ONS index lags Zoopla’s new lets index. It takes time for rents set at the leading edge to feed across the rest of the market as tenancies end and/or landlords increase rents during tenancies.
The average length of a tenancy varies depending on data source and ranges between 30 and 40+ months. Taking the average monthly growth in our new lets index over 33 months – and then expressing this on an annualised basis – delivers an annual growth rate that is very similar to the ONS index.
While the slowdown in rents for new lets is welcome news, many renters in existing tenancies are only starting to feel the impacts of higher rents over the last 3 years.
We expect rental inflation to slow to 3-4% by the end of 2024 as weakening demand and affordability pressures limit rental growth. Weaker rental growth in cities will lead the slowdown, but there is a large rental market outside cities where there is room for above-average growth. This explains the more drawn-out slowdown in rents. Tax and policy change will continue to see some landlords exiting the market, keeping supply constrained. This will keep an upward pressure on rents into 2025.
House price inflation slows to 1.8% as the supply of homes for sale outpaces the growth in sales agreed
The housing market gets off to its strongest start in three years, with new sales agreed up 12 per cent on 2024.