UK House Price Index – November 2023

Research and Insight November 2023
Top insights
- 1.2 %

Current UK house price growth (YoY)

34 %

Homes for sale versus a year ago

- 2.5%

Discount from asking to achieved price

Executive summary

"There is evidence of greater realism amongst sellers on pricing with a growing acceptance that what a home might have been worth a year ago is now largely academic given current market conditions."

Richard Donnell Executive Director - Research
Demand and sales up on last year, but so is overall supply
In Detail

Housing market continues to adjust to higher rates

Our latest report explores how the housing market continues to adjust to higher mortgage rates through lower transactions and widespread, albeit modest house price falls.

There is evidence that sellers are steadily becoming more realistic on pricing, although this means accepting ever larger discounts from the asking price.

Sales agreed are holding up relatively well but there are many more homes for sale than recent years. This is boosting choice and re- enforcing the buyers’ market, especially for 3 and 4+ bed houses where supply has rebounded the most.

The soft adjustment in pricing will continue to run over 2024. In addition, greater signs of realism on pricing by sellers will support sales volumes into 2024

+15% New sales agreed vs. a year ago

Sales holding up despite weak demand

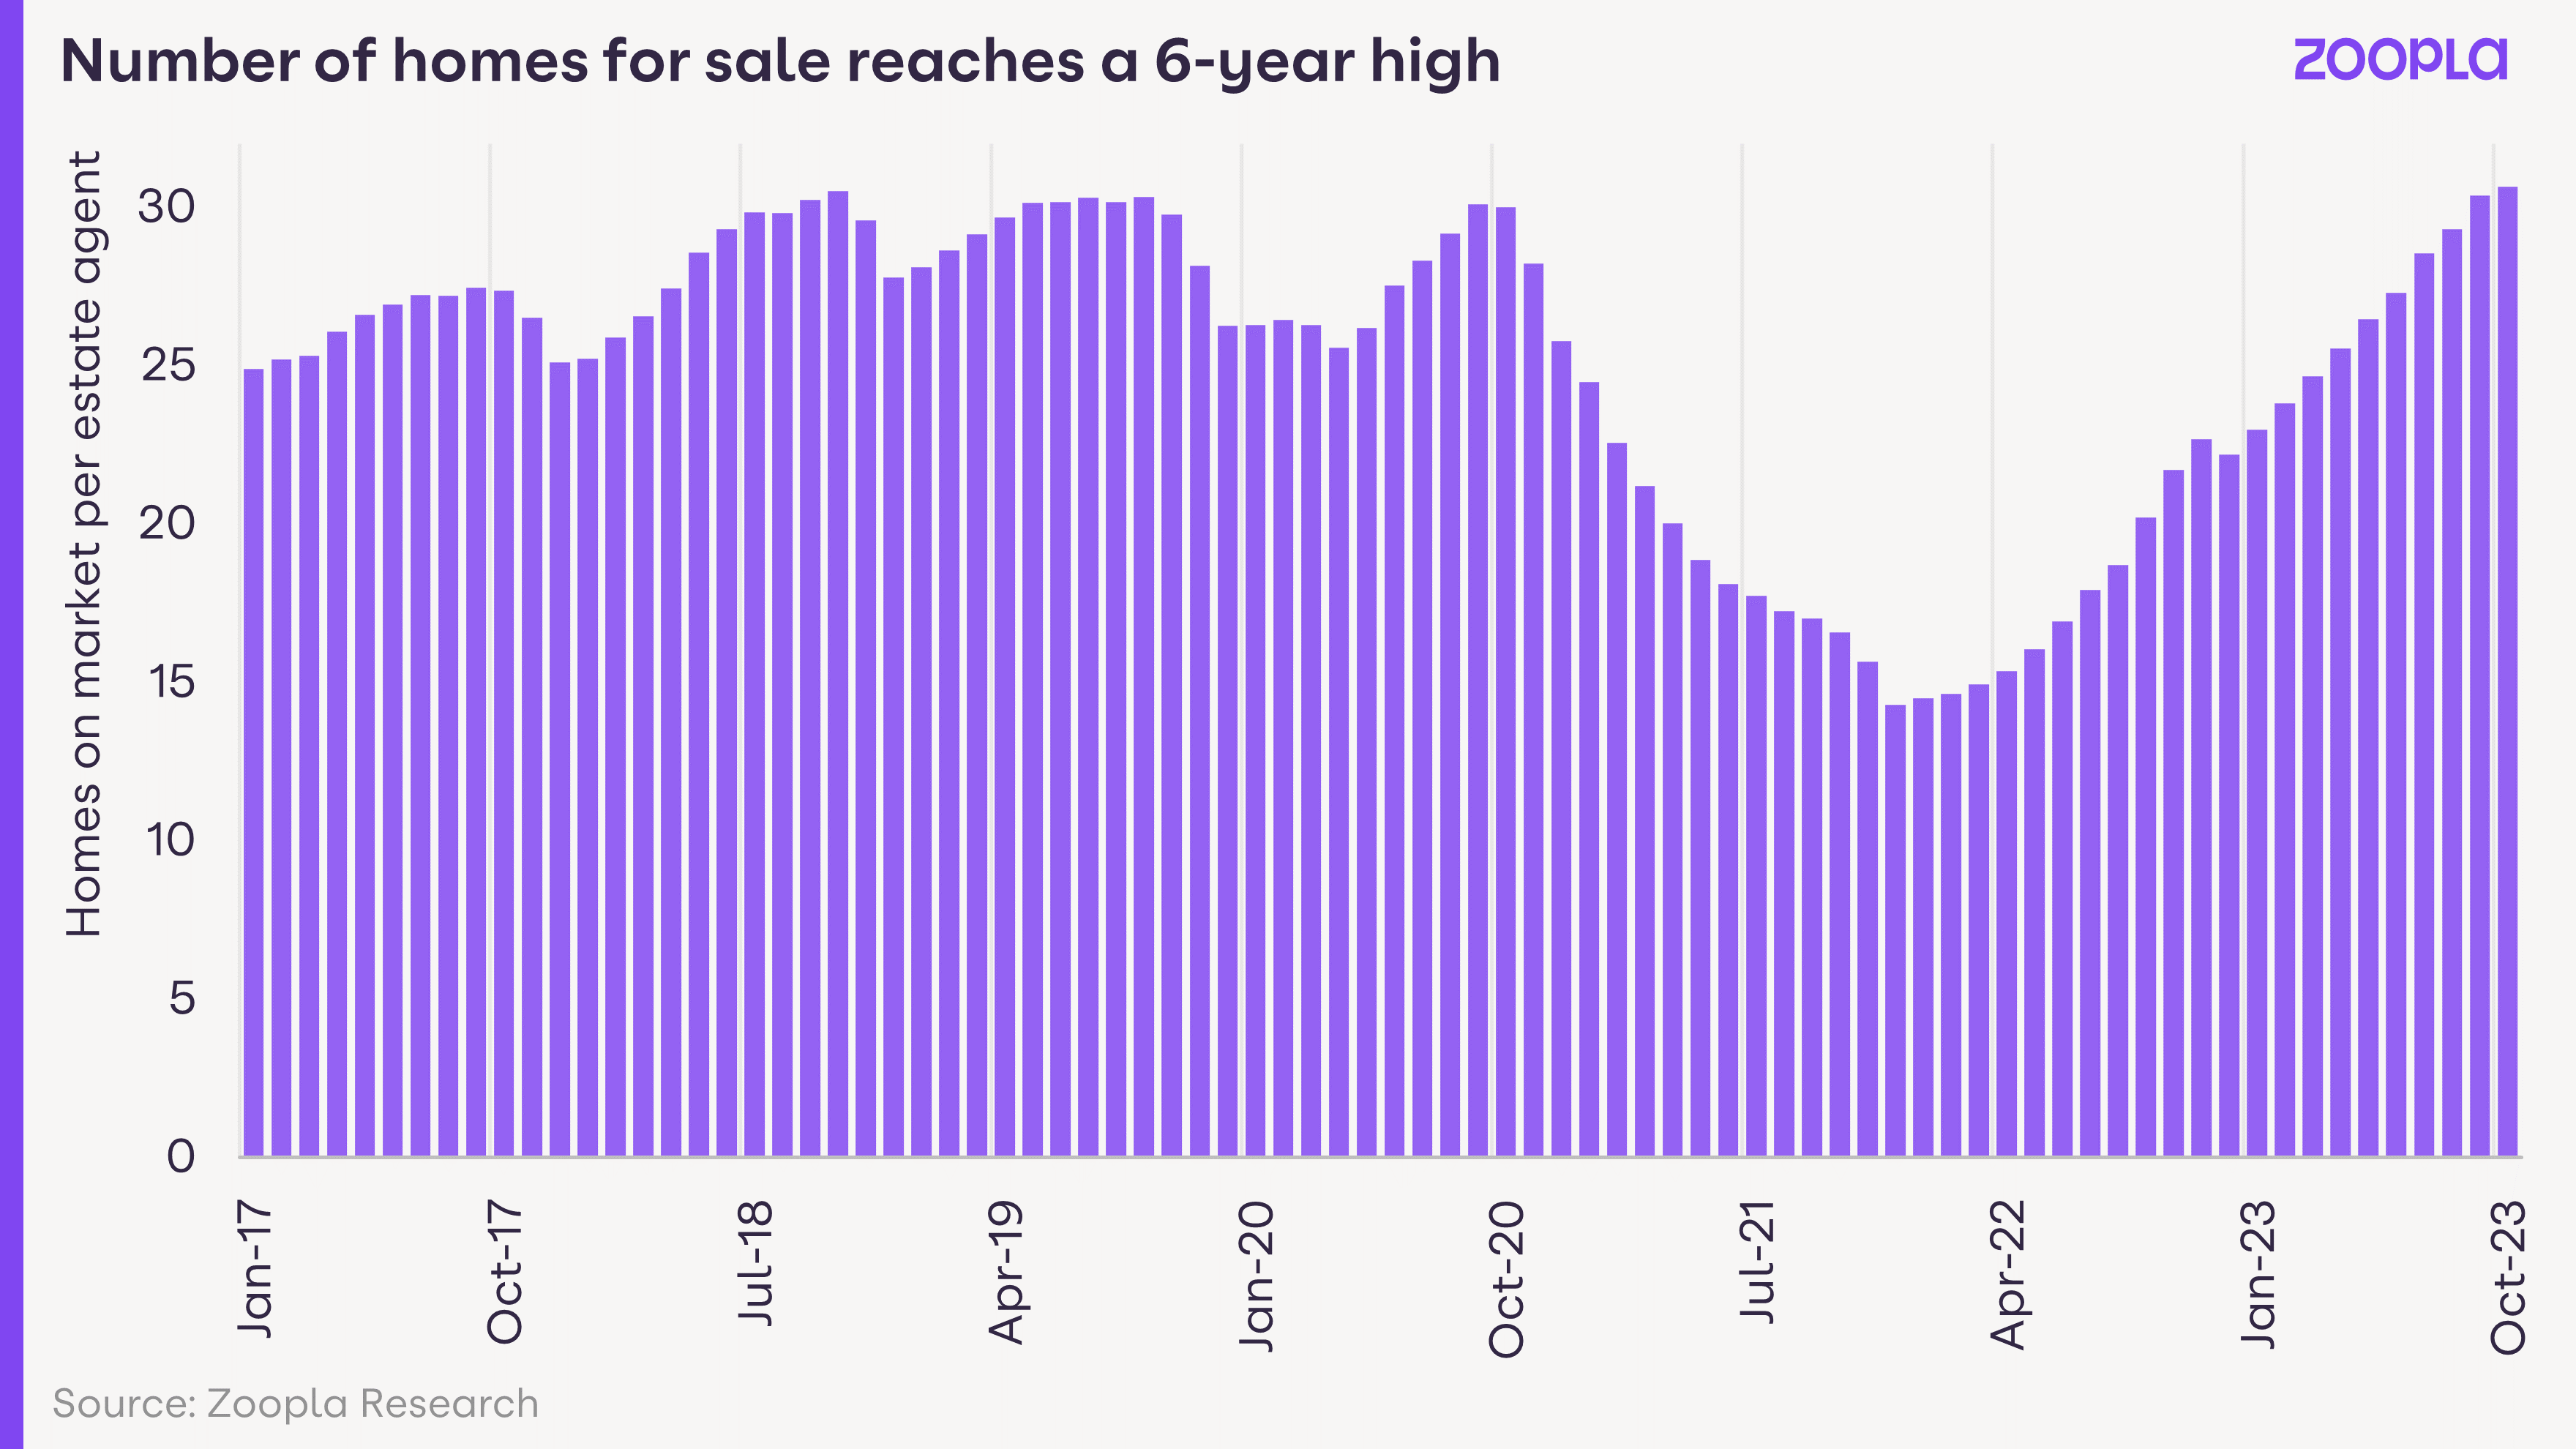
Buyer demand weakened over the summer as mortgage rates increased. While there has been a modest rebound over the autumn, demand remains 13% lower than 2019. Demand is also 10% higher than last year when the fallout from the mini budget drove a rapid decline in buyer interest.

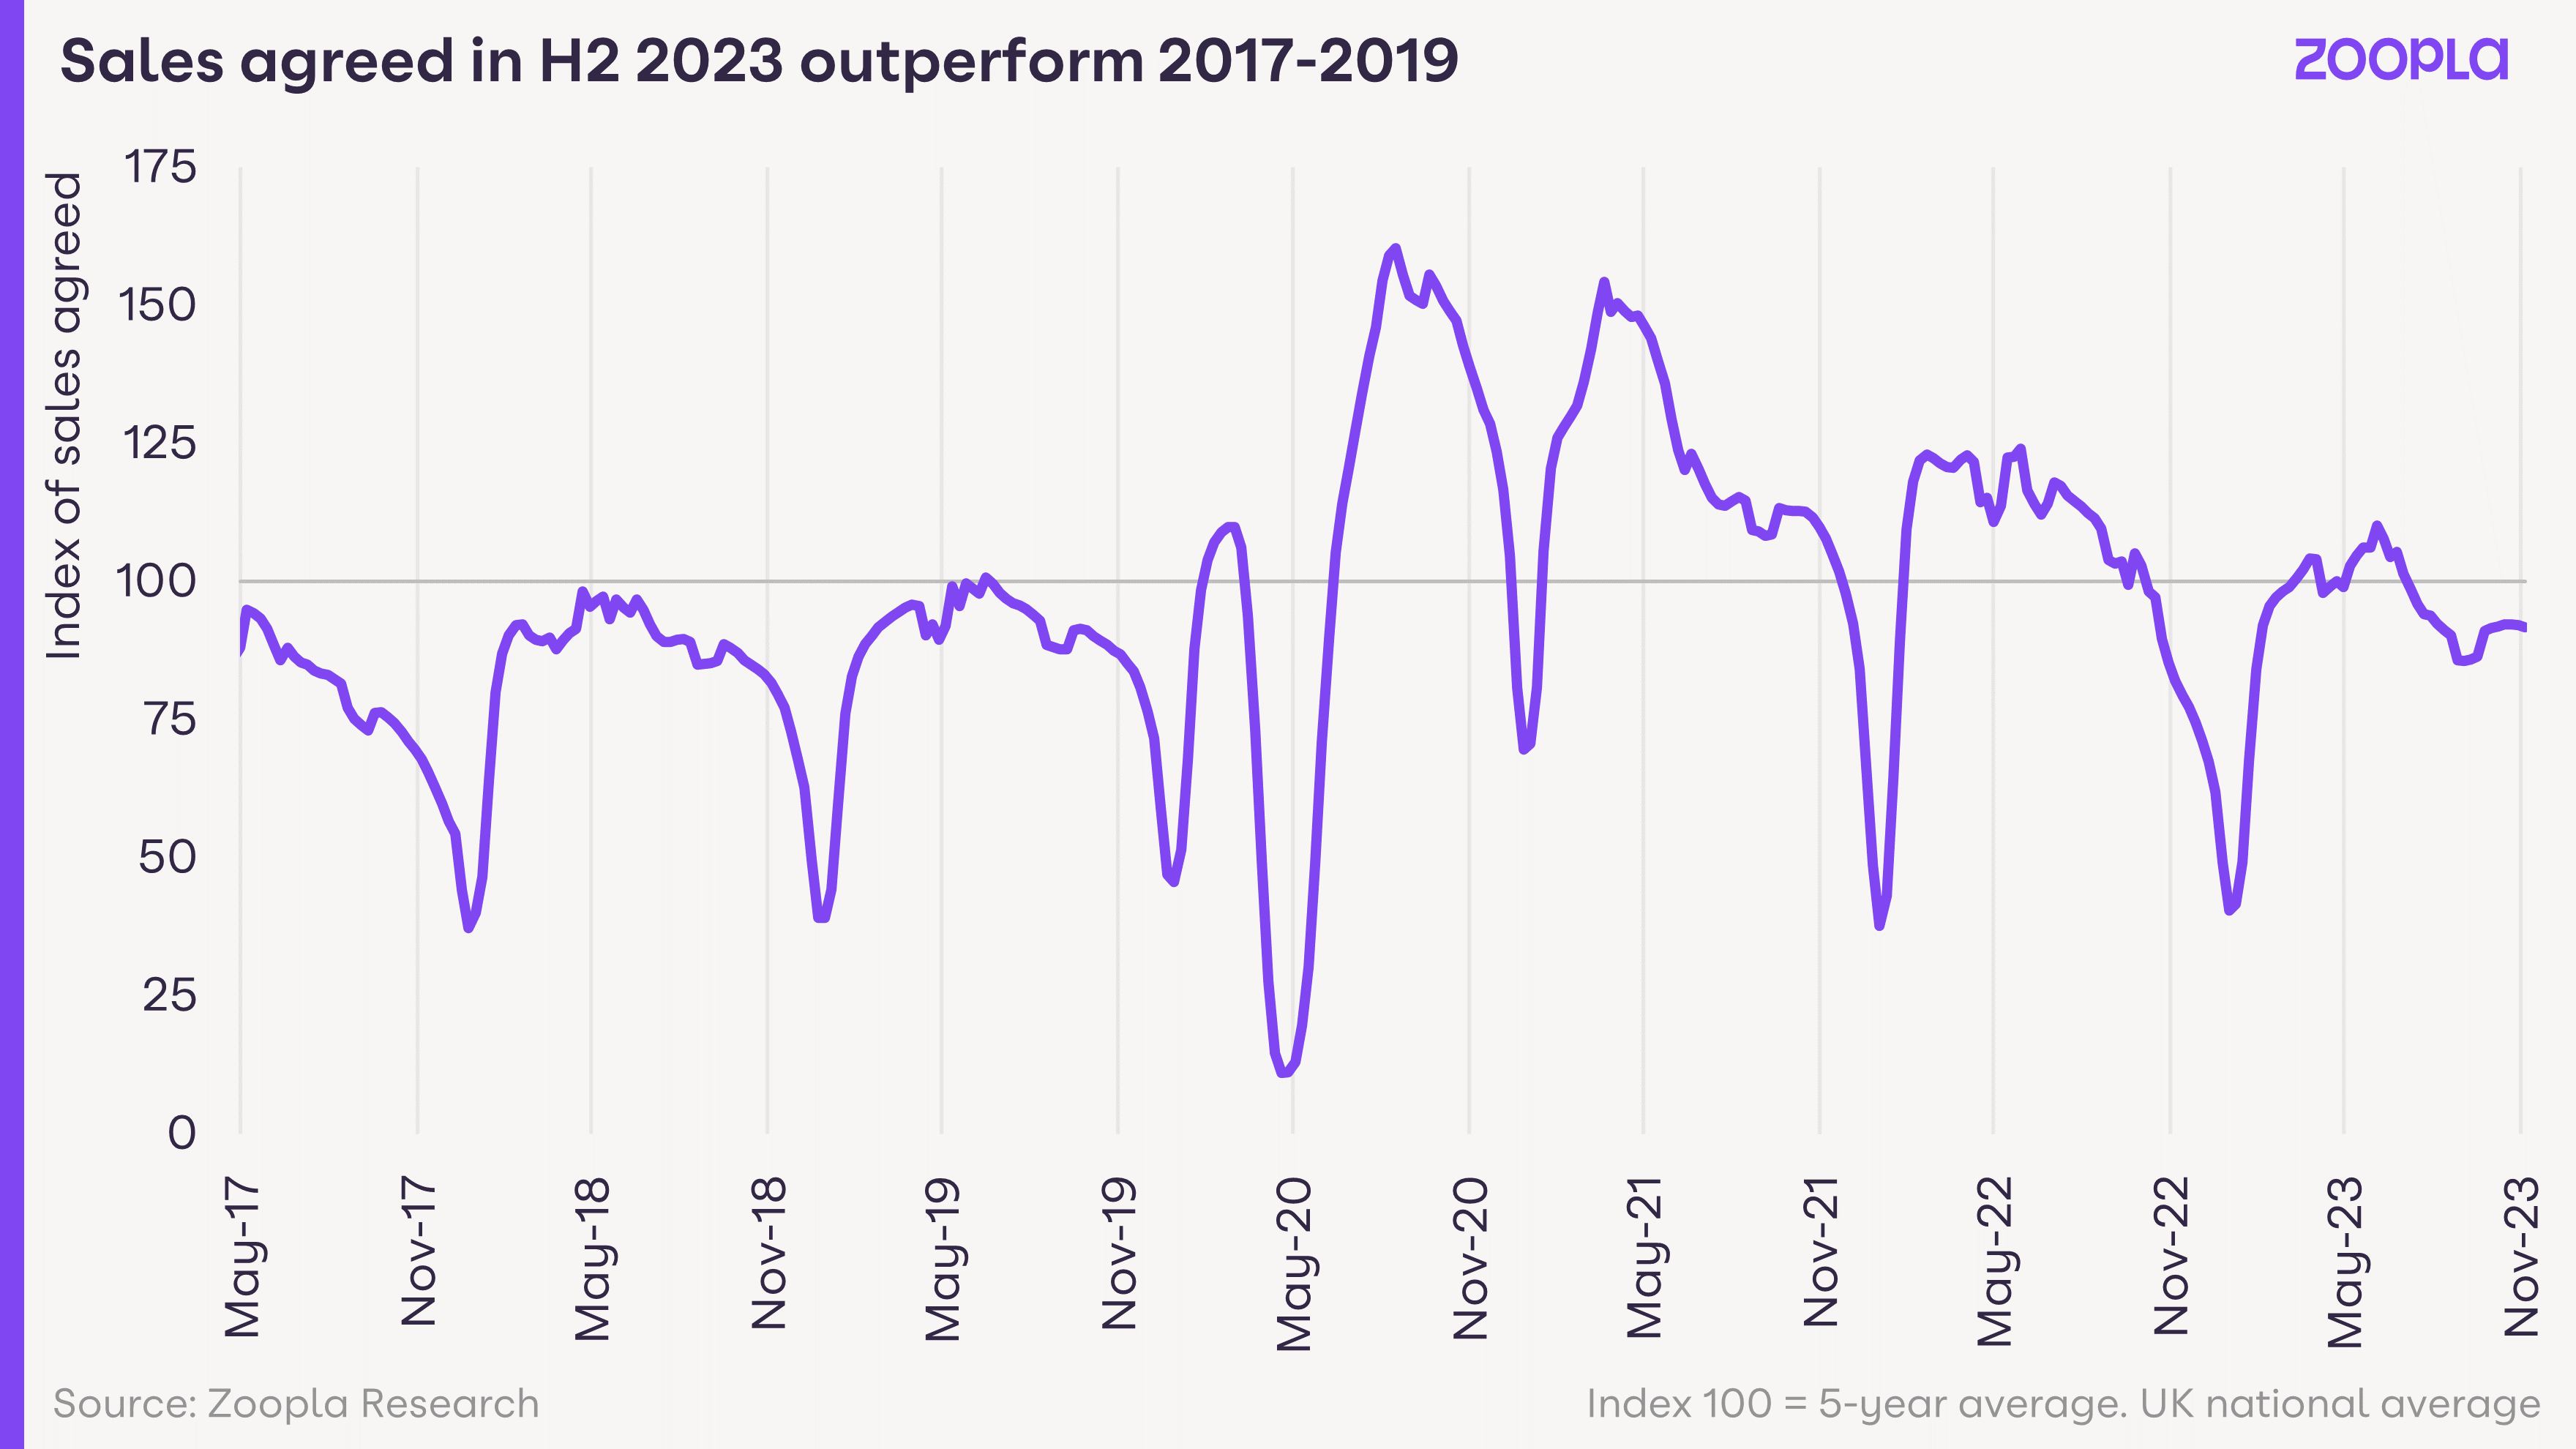
While there are fewer buyers in the market, new sales are still being agreed, tracking 15% higher than a year ago and 5% higher than 2019 levels. This indicates greater realism on the part of sellers and a growing sense that mortgage rates may have peaked and could start to fall later in 2024. It is encouraging those who have delayed decisions to commit to new agreeing purchases, especially if there are better deals to be had from a stronger negotiating position.

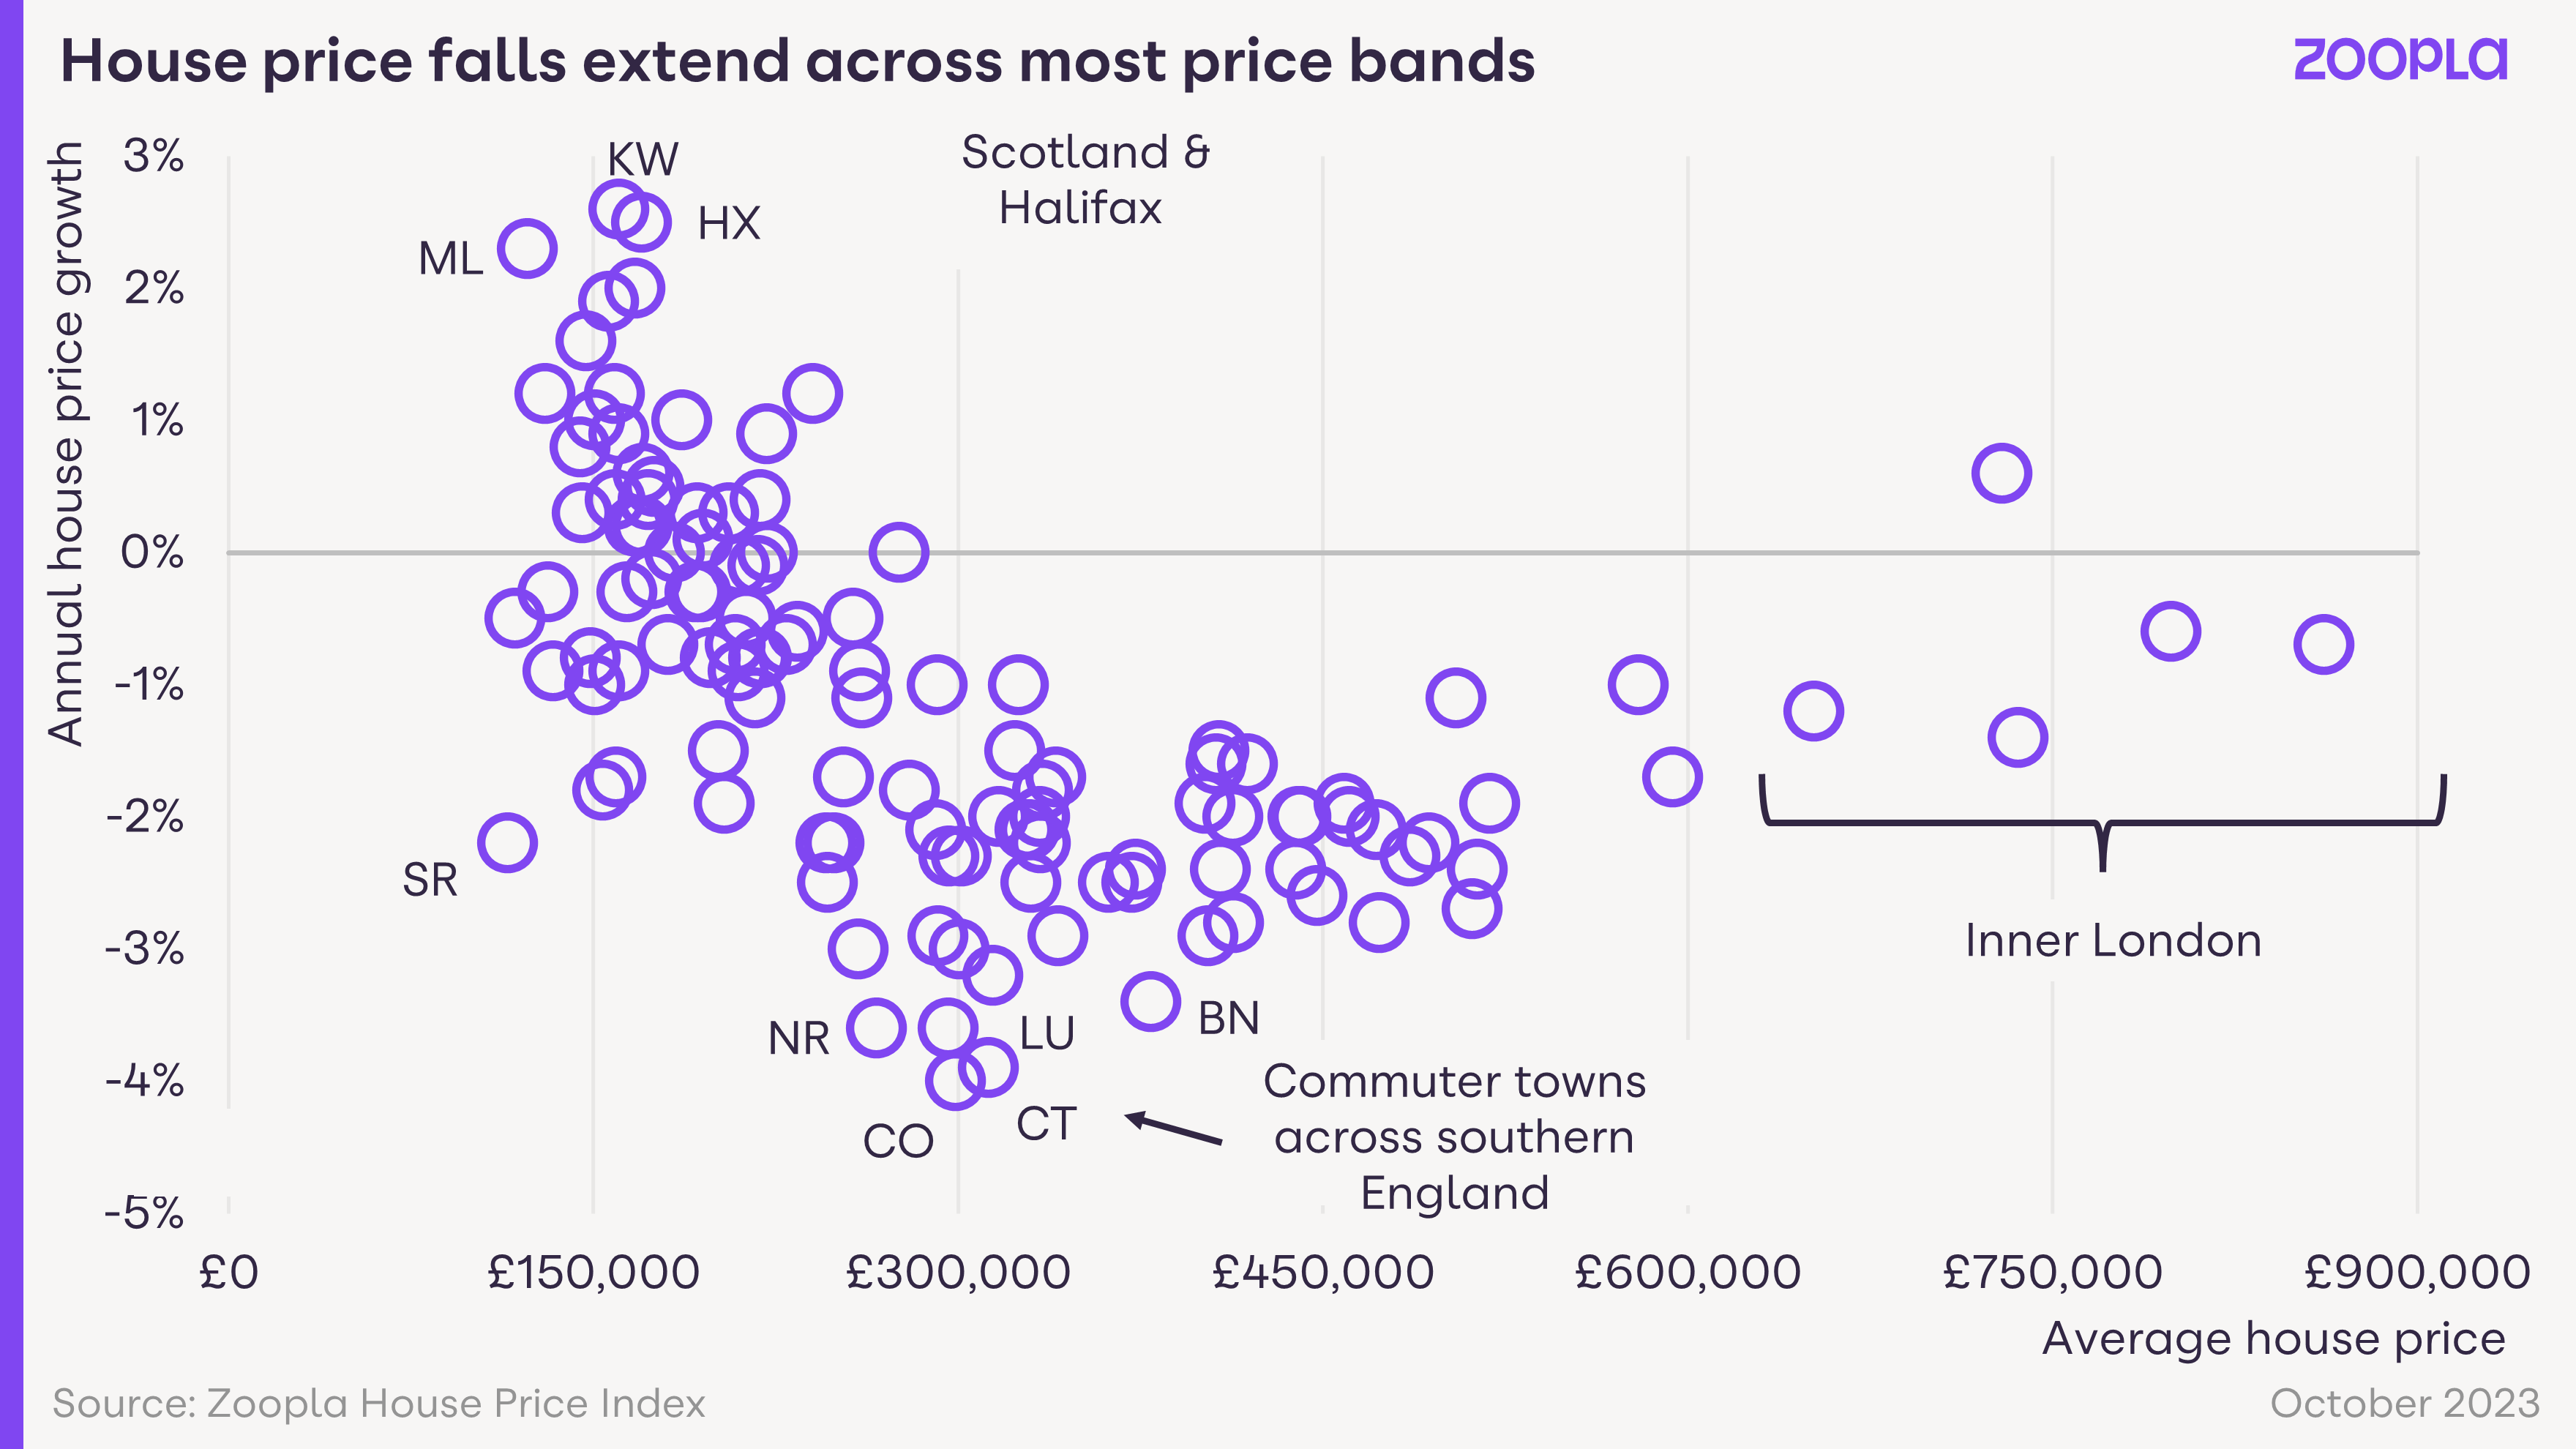
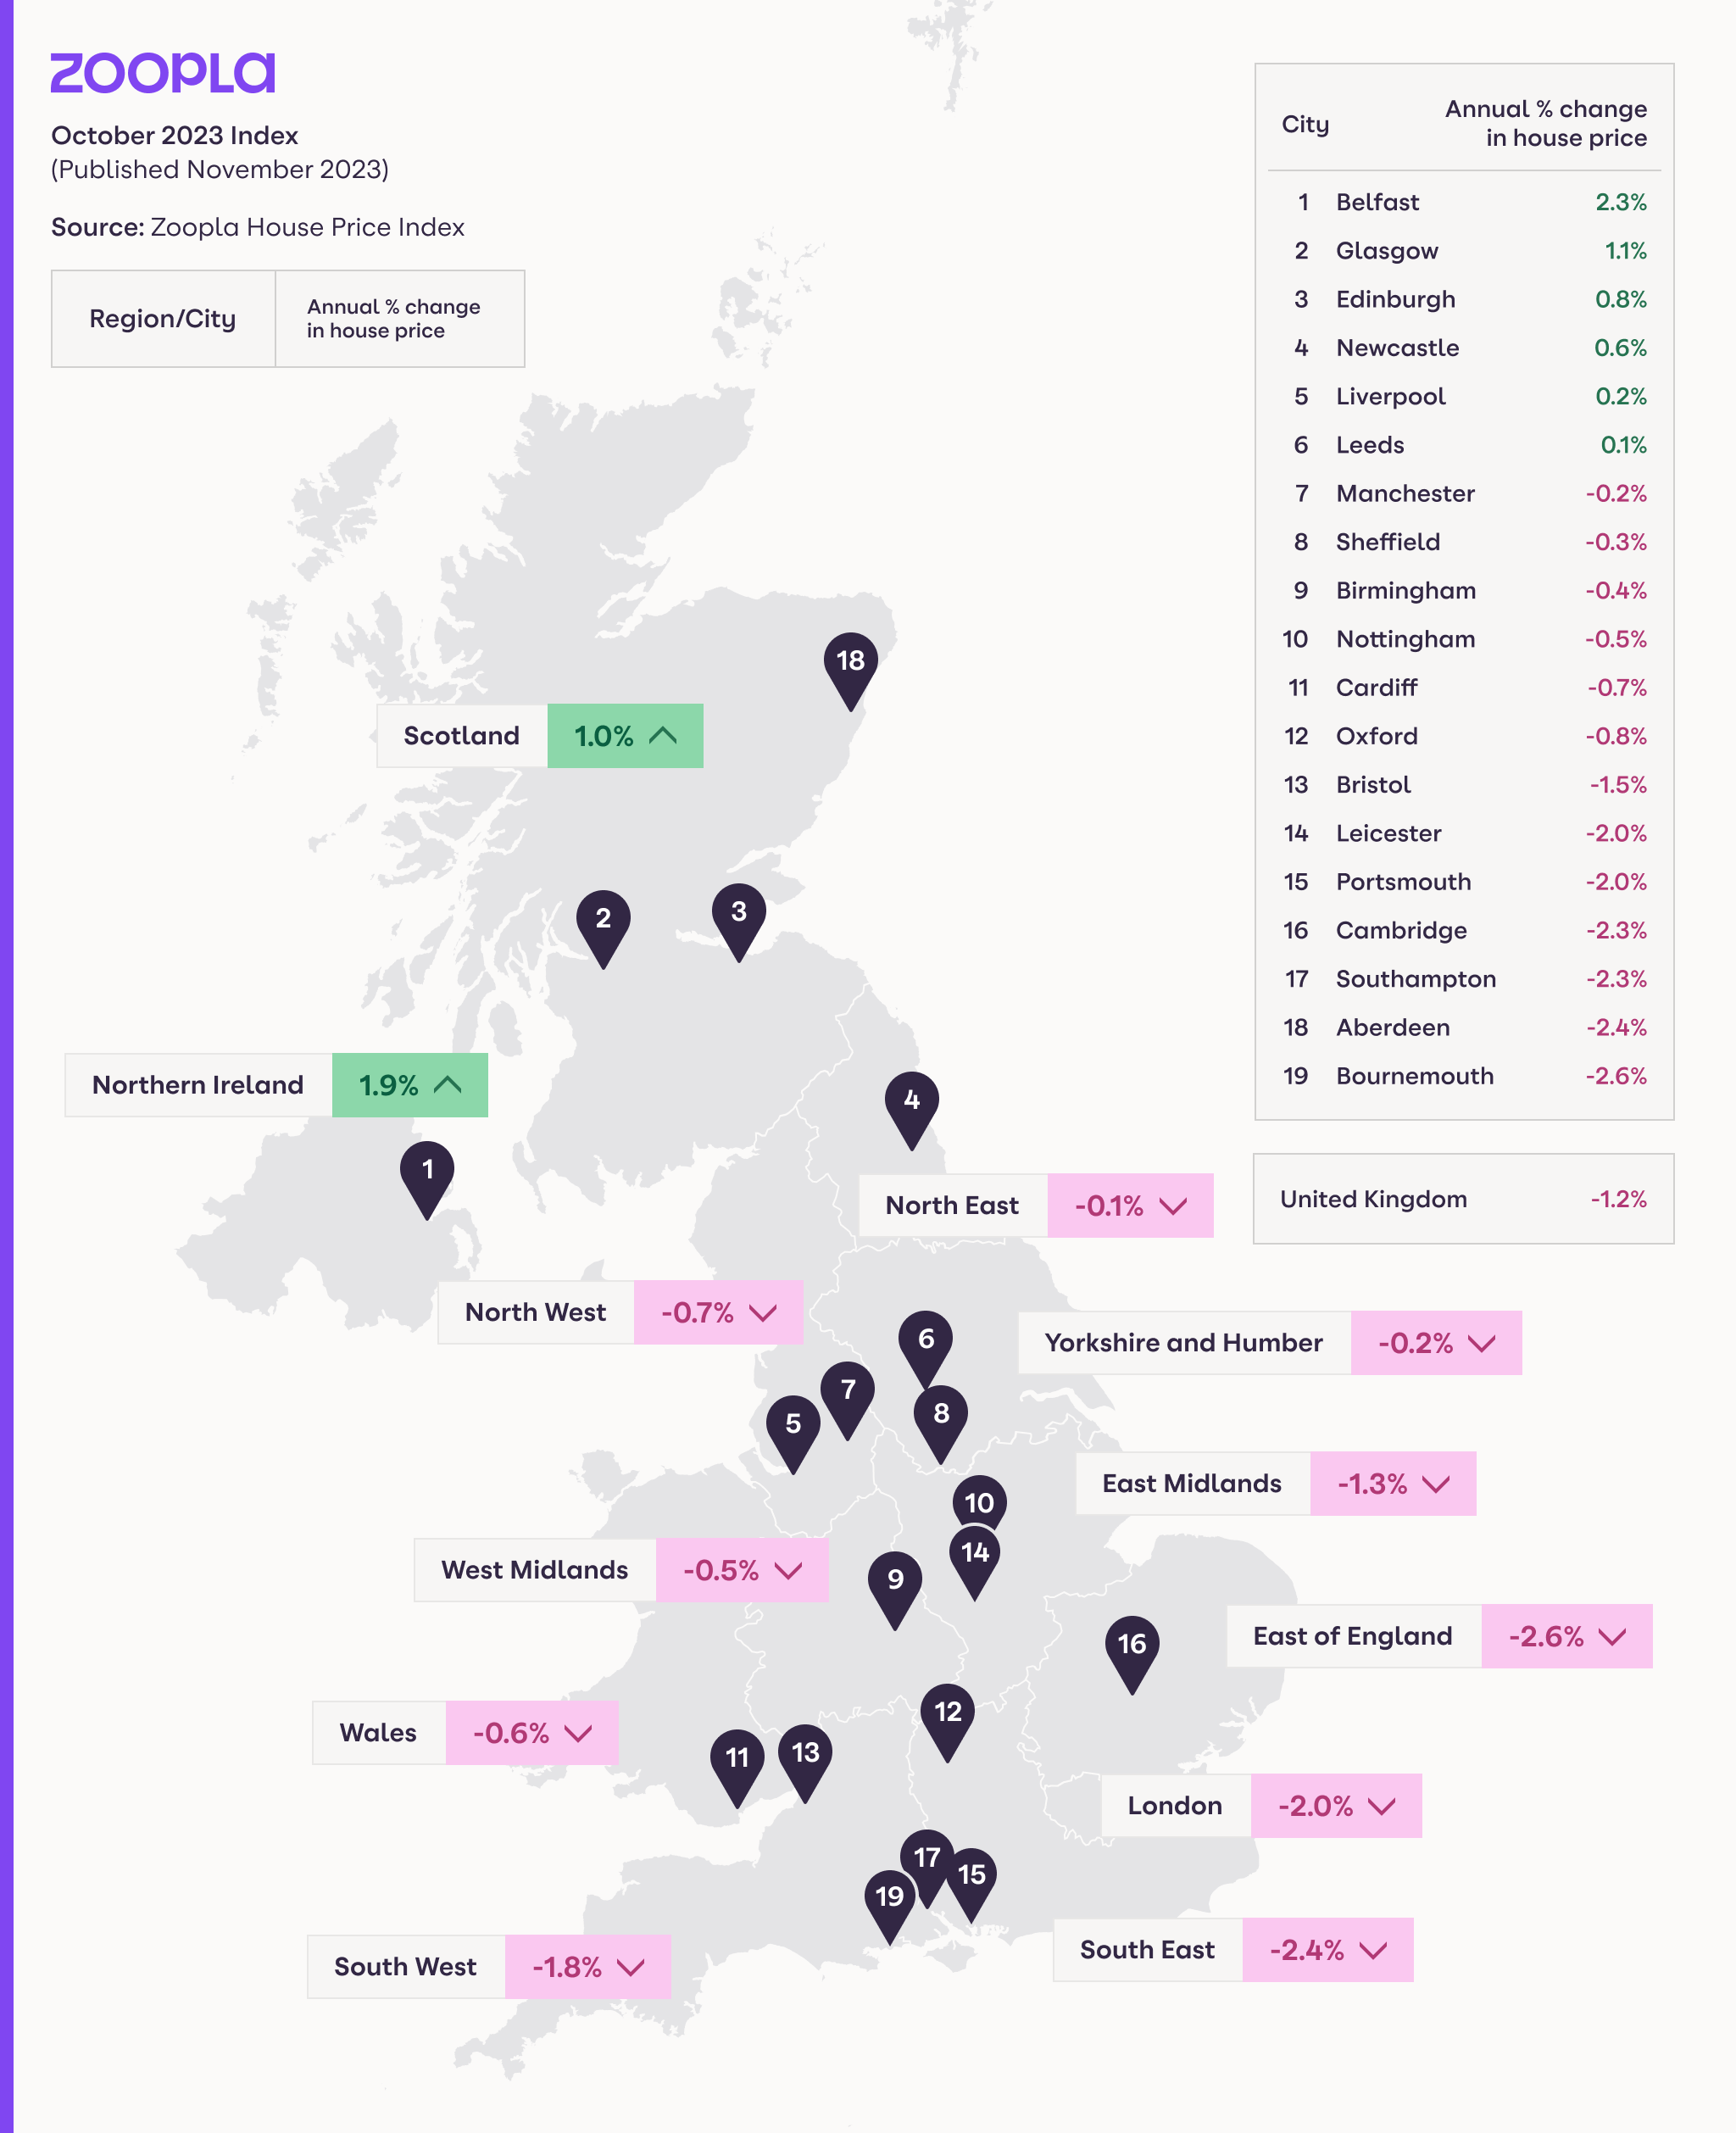
Sales are holding up across many parts of Scotland and have also picked up across inner London, where market activity has under- performed the rest of the UK over recent years. Overall, the market is on track for 1m sales completions in 2023 but the pipeline of deals as we approach the end of the year is the lowest for 4 years.

background image

UK prices 1.2% lower as most markets register price falls

Our latest index shows that the average UK house price has fallen by 1.2% over the last 12 months. At a regional level, house prices are falling across all areas of England and Wales led by the Eastern region at -2.6%, followed by the South East (-2.4%) and London (-2.0%).

Prices are 1% higher in Scotland. Prices are falling across the country and across all price bands. The annual decline in house prices remains in low single digits reaching up to -4% in the Colchester (CO) postal area.

The larger price falls are concentrated across southern England, especially in markets that registered strong demand and fast price growth over the pandemic ‘race for space’. Now demand is falling and supply is growing, it means average prices are falling off a higher base although prices remain well above the pre-pandemic levels.

-4.0% House price growth in Colchester postal area
background image

Value for money supporting sales and prices in London

While higher mortgage rates have hit buying power, there is no evidence of an acceleration in price falls in the highest value markets such as London. Annual price falls in London are lower than across the wider South East and adjacent commuter areas.

While London house prices are high in absolute terms, they have failed to keep pace with the rest of the UK over the last six years. The average value of a London home is just 8% higher than seven years ago, in nominal terms, whereas UK house prices are 28% higher.

Better value for money and a steady return to office working is supporting sale volumes and pricing levels in London. New sales have rebounded more in London than any other part of the UK over the last 2 months. This has led to a slight firming in prices and values in the EC postal area are positive at +0.6% over the last year.

Record high supply of homes for sale

A chronic scarcity of homes for sale over the pandemic, particularly for 3+ bed family houses, was a key driver of high house price inflation.
This position has fully reversed with the highest number of homes for sale per estate agent for six years.

The rebound in supply has been recorded in the market for 3 and 4+ bed family homes, a trend across all parts of the UK. Only in Scotland, the North-East and North-West are levels of supply still below their pre-pandemic levels.

The average estate agency branch has 31 homes for sale, compared to a low of just 14 in the middle of the pandemic boom. This is boosting choice amongst would-be buyers and providing them with much greater negotiating power with sellers as they agree pricing.

background image
34% More homes for sale than a year ago

Largest discounts to asking price for over 5 years

The strength of the buyers’ market is evidenced by the fact that the discount to asking price for achieved sales is now at a 5-year high. This also signals evidence of greater realism amongst sellers with a growing acceptance that what a home might have been worth a year ago is now largely academic given current market conditions.

During the pandemic years buyers had to pay the asking price to secure a property. Over the course of 2023 the gap has widened and sellers have been accepting ever larger discounts to the asking price to agree a sale. In the first six months of 2023 discounts to the asking price averaged 3.4%.

This has now grown to 5.5% for sales over the first half of November – a median discount of £18,000 off the asking price. This is larger than the previous high recorded in 2018, the last time housing demand weakened, and prices came under downward pressure

Discounts to asking larger in southern England

The negotiating power of buyers is greatest in southern England where affordability is most stretched. The average discount to the asking price for sales is 6.1% across London and the South East. This represents an average £25,000 reduction off the asking price. Across the rest of the UK the discount is smaller at 4.8%, or £11,000, but still the highest level in recent years.

A proportion of sellers are accepting even bigger discounts to these averages with 1 in 4 sales agreed at more than 10% below asking price.

These discounts reflect the fact that sellers haven’t been cutting asking prices very quickly. As more sellers adjust asking prices lower we expect these discounts will start to return to normal levels of 3-4%.

£25k Average discount to the asking price across London and South East

Outlook

The current repricing of housing has further to run in 2024. It’s a positive that the number of new sales agreed is holding up, evidence that there are willing buyers and willing sellers ready to agree sales albeit at bigger discounts to asking price.

While 5-year fixed mortgage rates have been falling below 5%, they need to fall further to bring more buyers back into the market. Rising earnings and incomes are slowly improving buying power but house prices haven’t fallen enough to offset the impact of higher rates.

We expect the number of homes for sale to start declining as some sellers take their property off the market with a view to relaunching in the new year. Homeowners that are serious about selling in H1 2024 need to set their asking price realistically to attract demand and agree a sale, especially in light of increased supply.

Financial markets expect the Bank of England to start cutting rates around the summer of 2024. If mortgage rates start to fall further, this will support an improvement demand and sales volumes later in 2024 but prices will remain under modest downward pressure.

House Price Index – Country, region and city summary

Note: The Zoopla house price index is a repeat sales-based price index, using sold prices, mortgage valuations and data for agreed sales. The index uses more input data than any other and is designed to accurately track the change in pricing for UK housing.

background image

Zoopla House Price Index, city summary, November 2023

Source: Zoopla House Price Index. Sparklines show last 12 months trend in annual and monthly growth rates – red bars are a negative value – each series has its own axis settings providing a more granular view on price development.

background image
Key Contacts

UK House Price Index report produced by

Richard Donnell

Executive Director - Research

Izabella Lubowiecka

Senior Property Researcher
Related Content
Estate agency
Housebuilders
UK House Price Index
background image

UK House Price Index – April 2024

The housing market continues to adjust to higher mortgage rates. Sales volumes are rising and house prices are static.

Estate agency
Housebuilders
UK House Price Index
background image

UK House Price Index – March 2024

Market activity improves across all key measures led by sales, which are 9% higher than a year ago.

Lettings
Rental Market Report
background image

Zoopla UK Rental Market Report – March 2024

Our Rental Market Report for March 2024 looks at the latest trends in rental pricing, supply and demand.