Search
close
Stay in the loop with our monthly newsletter, bringing you a fresh take on all things property.
Form funnels into a Pardot list to update Prospect sign up for Estate Agent and New Homes
"*" indicates required fields
Annual UK house price inflation
Over 2023 vs. 2022
over 2023 from decline in house price to earnings ratio
While house price growth has slowed rapidly over the last year, the primary impact of higher mortgage rates has been lower sales volumes.
The housing market continues to adjust to higher mortgage rates and cost-of-living pressures with weaker demand, fewer sales and very low house price growth. It is a slow and drawn-out process exacerbated by seasonal factors.
Market activity continues to track in line with 2019 levels but remains well below levels of activity recorded over the more recent pandemic
years. Looking at the last 4 weeks, our leading indicators show demand for homes is running 34% lower than the average compared to the same period in last 5 years (2018-2022). Sales agreed are down to a lesser degree (-20%) as the availability of homes for sale has rebounded after a period of scarcity.
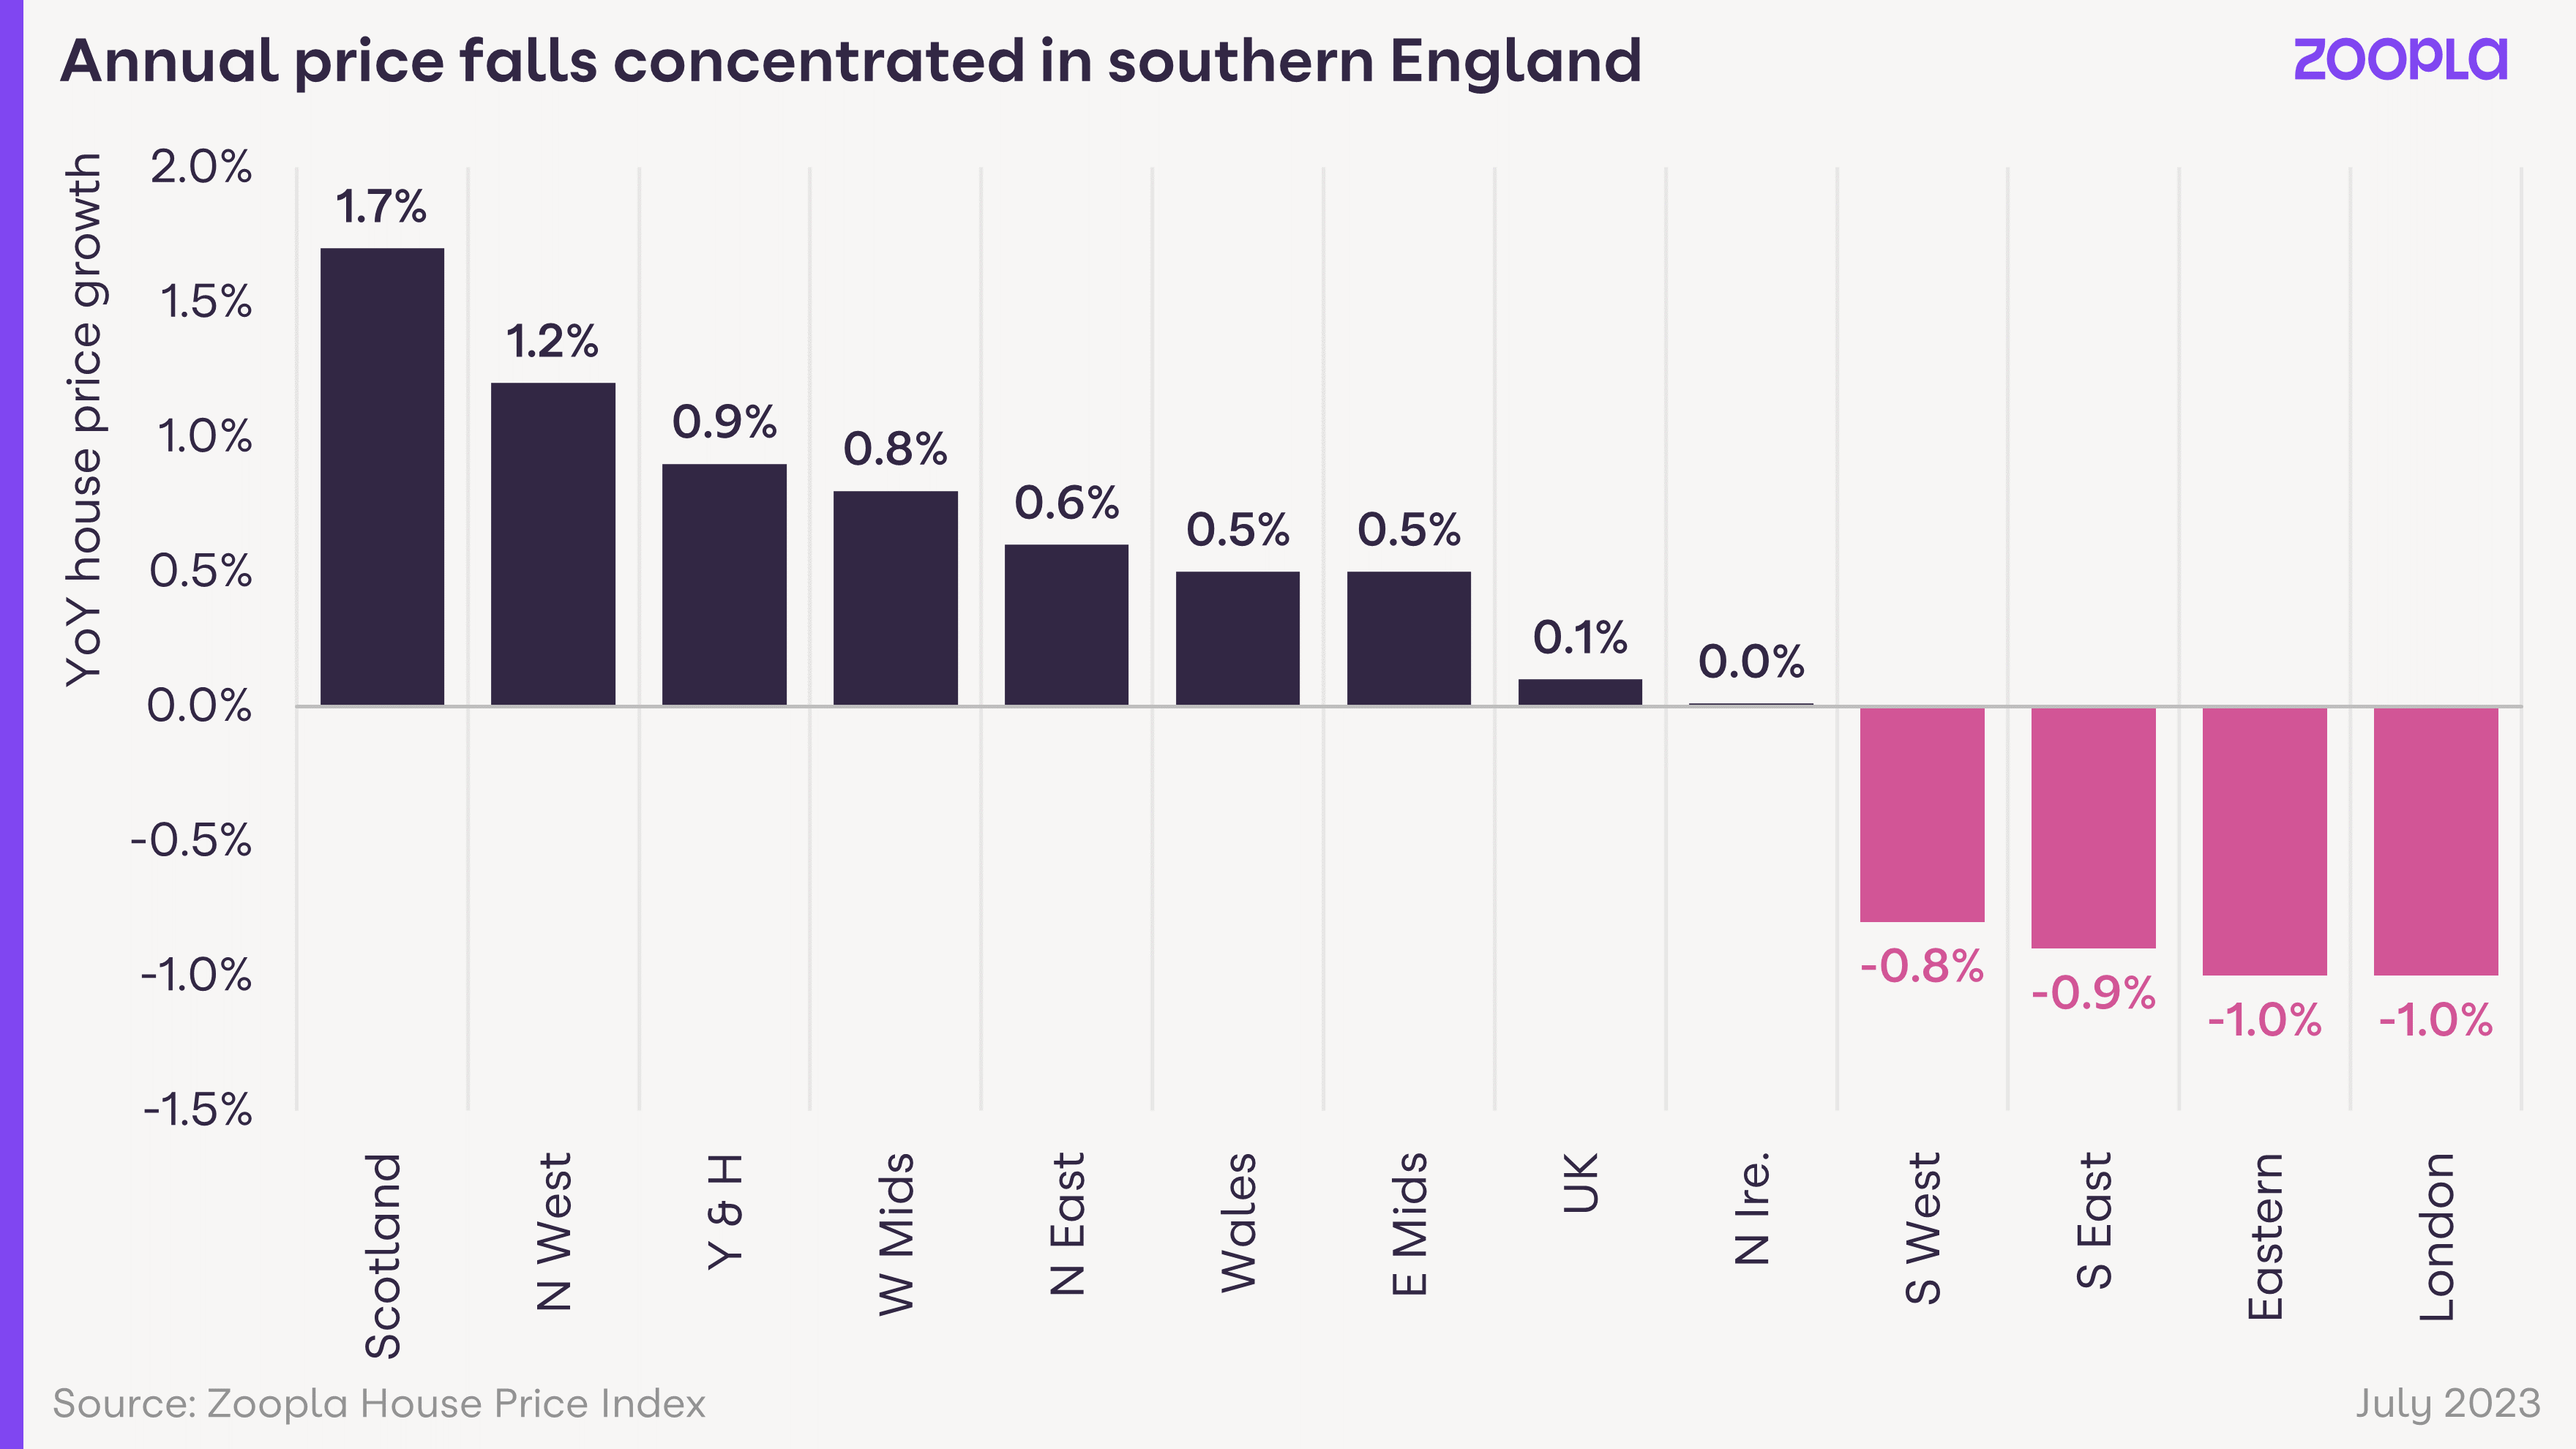
Weaker demand, more price-sensitive buyers and fewer sales have led to a rapid slowdown in house price inflation over the last year. Annual UK house price growth at +01% is at a virtual standstill.
This is the lowest annual growth rate for over 12 years – since August 2012. There is a clear north-south divide in house price inflation. All regions across southern England are registering year-on-year price reductions of up to -1%. All other regions and countries of the UK are posting low, single digit price growth. Scotland is registering growth of +1.7%.
This pattern of price changes reflects the greater impact of higher mortgage rates on higher-value housing markets. Buyers in southern England need larger mortgages, bigger deposits and higher incomes to buy.
This effectively prices more buyers out of the market, weakening demand and pushing down prices. In contrast, levels of market activity are holding up better in more affordable markets, in particular, Scotland. These trends will continue over the rest of 2023 and into 2024.
We believe that the variation in house price growth across the UK is partly explained by the ability of first-time buyers (FTBs) to buy at higher mortgage rates.
FTBs account for 1 in 3 sales a year, most of whom originate from the private rental market. This means the dynamics of renting and buying will impact on demand and prices. Low mortgage rates over recent years made mortgage repayments for buying much cheaper than renting.
This supported FTB demand and led to many FTBs opting to buy 3+ bed homes, bypassing the market for flats and smaller houses. Mortgage rates over 5% have now reversed this trend at the national level, making renting 10% cheaper than buying at a UK level, despite high growth in rents in recent years.
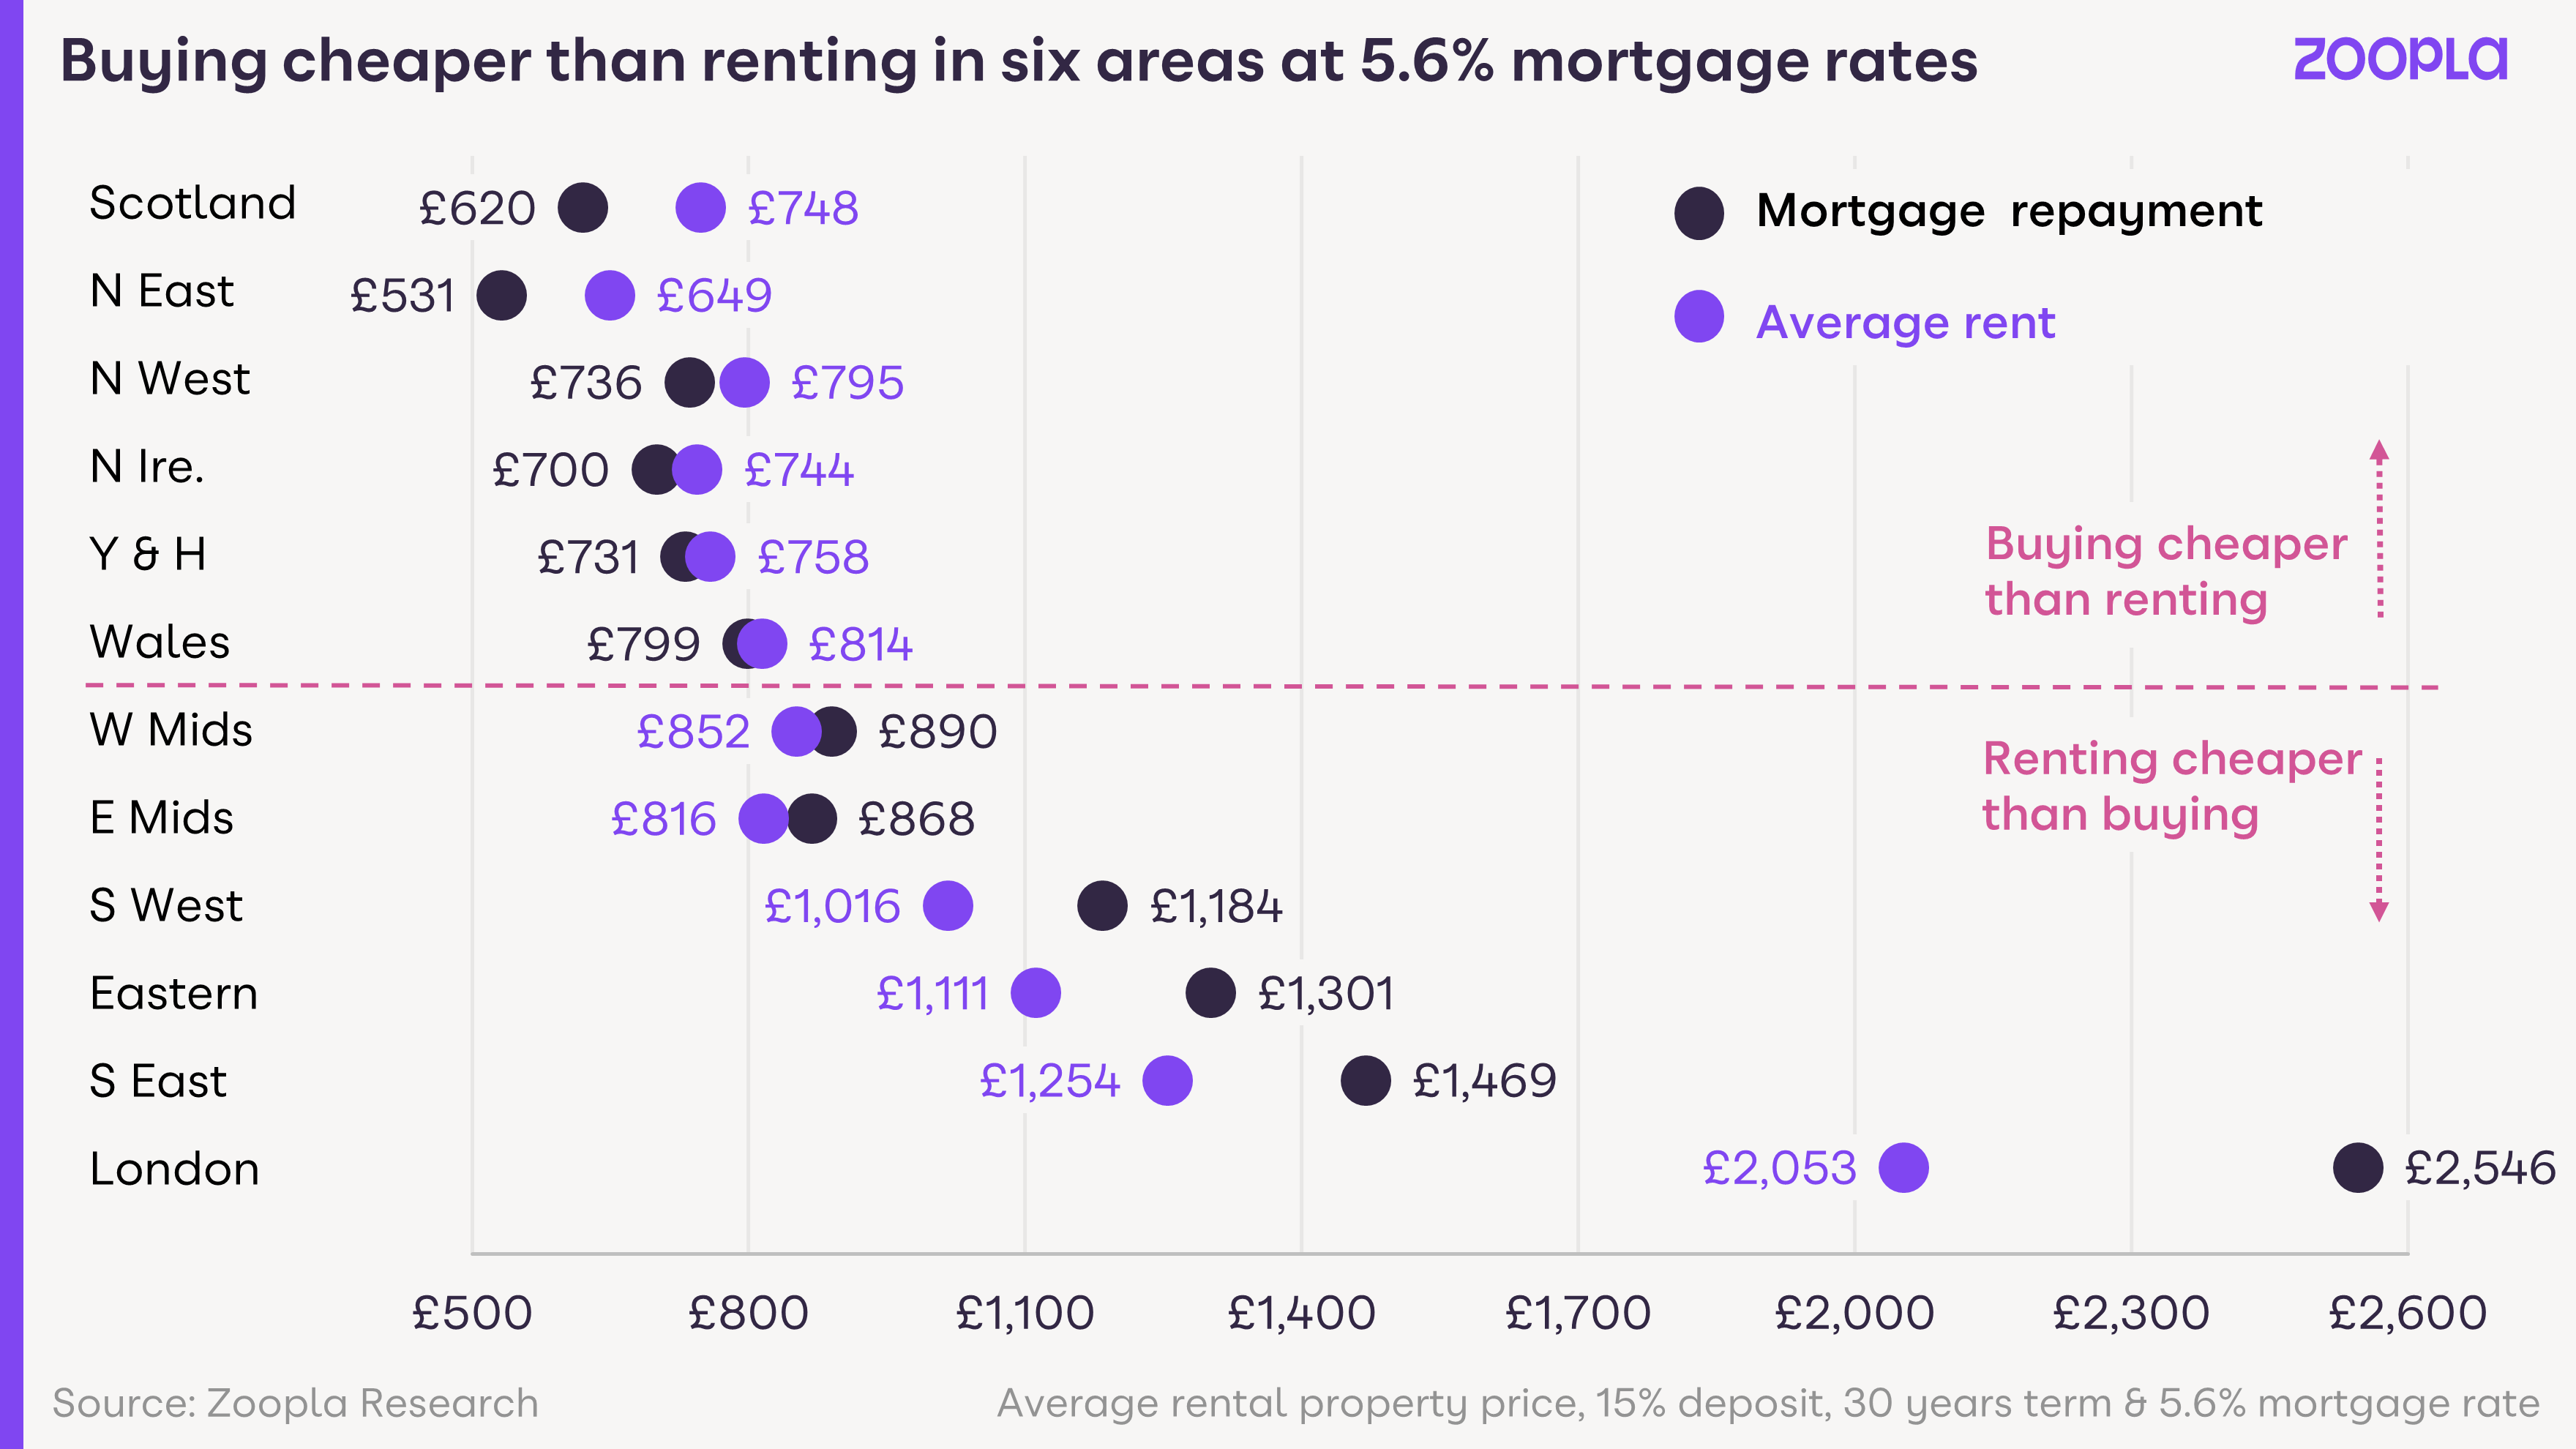
However, the experience for would-be FTB buyers varies across the UK. A renter buying the home they rent1 would find it cheaper to buy than rent in the six regions and countries with the lowest house prices. In Scotland and the North East average mortgage repayments are up to 18% lower than rental costs. This supports access to the housing market and the demand for homes.
In contrast, it is more expensive to buy a home than to rent across all areas of southern England and Midlands. In London, the average monthly payment is 24% higher than the monthly rent. Higher mortgage rates are pricing more FTBs out of the sales market across southern England, reducing demand and compounding the downward
pressure on house prices.
The actual position is worse for all FTBs when allowing for the fact that mortgage lenders require new borrowers to be able to afford higher ‘mortgage stress rates’ of closer to 8.5% rather than the product rate of 5.6% used in this analysis. This reinforces our view that price reductions will remain concentrated across southern England where affordability challenges are greatest. Lower house prices and mortgage rates are needed to stimulate demand and sales.
While house price growth has slowed rapidly over the last year, the primary impact of higher mortgage rates has been lower sales volumes. Our data on the number of homes being sold ‘subject to contract’ over the year to date shows the market is still on track for 1m sales completions in 2023.
This will be 21% down on 2022 levels and the lowest number of sales since 2012. It’s the equivalent of the average household moving once every 23 years.

The big driver of this reduction is fewer sales funded by mortgages as a result of higher mortgage rates. Based on trends over H1, we estimate that cash sales will fall just 1% over 2023 compared to 2022 levels.
However, the number of mortgaged sales is projected to be 28% lower. The net decline across cash and mortgaged buyers is 21%.
Existing homeowners using a mortgage typically account for a third of annual sales. This group is under less pressure to move as they already have a home and, where possible, will be waiting until the outlook for mortgage rates improves from their current levels.
The economics of new buy to let purchases are also being squeezed by higher mortgage rates. Mortgaged buy-to-let purchases typically account for 8% of sales. Buy-to-let investors in southern England need to inject 40-50% of the property value as equity to get the numbers to stack up meaning new investment will be lower over 2023.
While first-time buyer numbers will be lower in 2023, we expect them to hold up as a result of more flexible working opening up options to buy in cheaper markets as well as buying costs being lower than renting in more affordable markets.
In addition, more landlord selling previously rented homes, which are typically priced 25% lower than the wider market, is boosting available supply that appeals to FTBs.
Housing affordability remains the primary barrier to more sales – both the level of house prices and the cost of mortgage repayments. The challenge is the greatest in southern England where the household income to buy a home remains high at over £75,000 in many market areas.
Higher mortgage rates have increased UK mortgage repayments by 23% or £216 per month over the last year.
Mortgage rates are starting to drift lower but remain over 5%. We expect them to fall below 5% later this year but it looks set to be a drawn-out process as the financial markets re-evaluate how much longer interest rates need to remain higher to bring inflation under control. Any further improvement in affordability from lower mortgage rates is unlikely to impact on the market until 2024 H1.
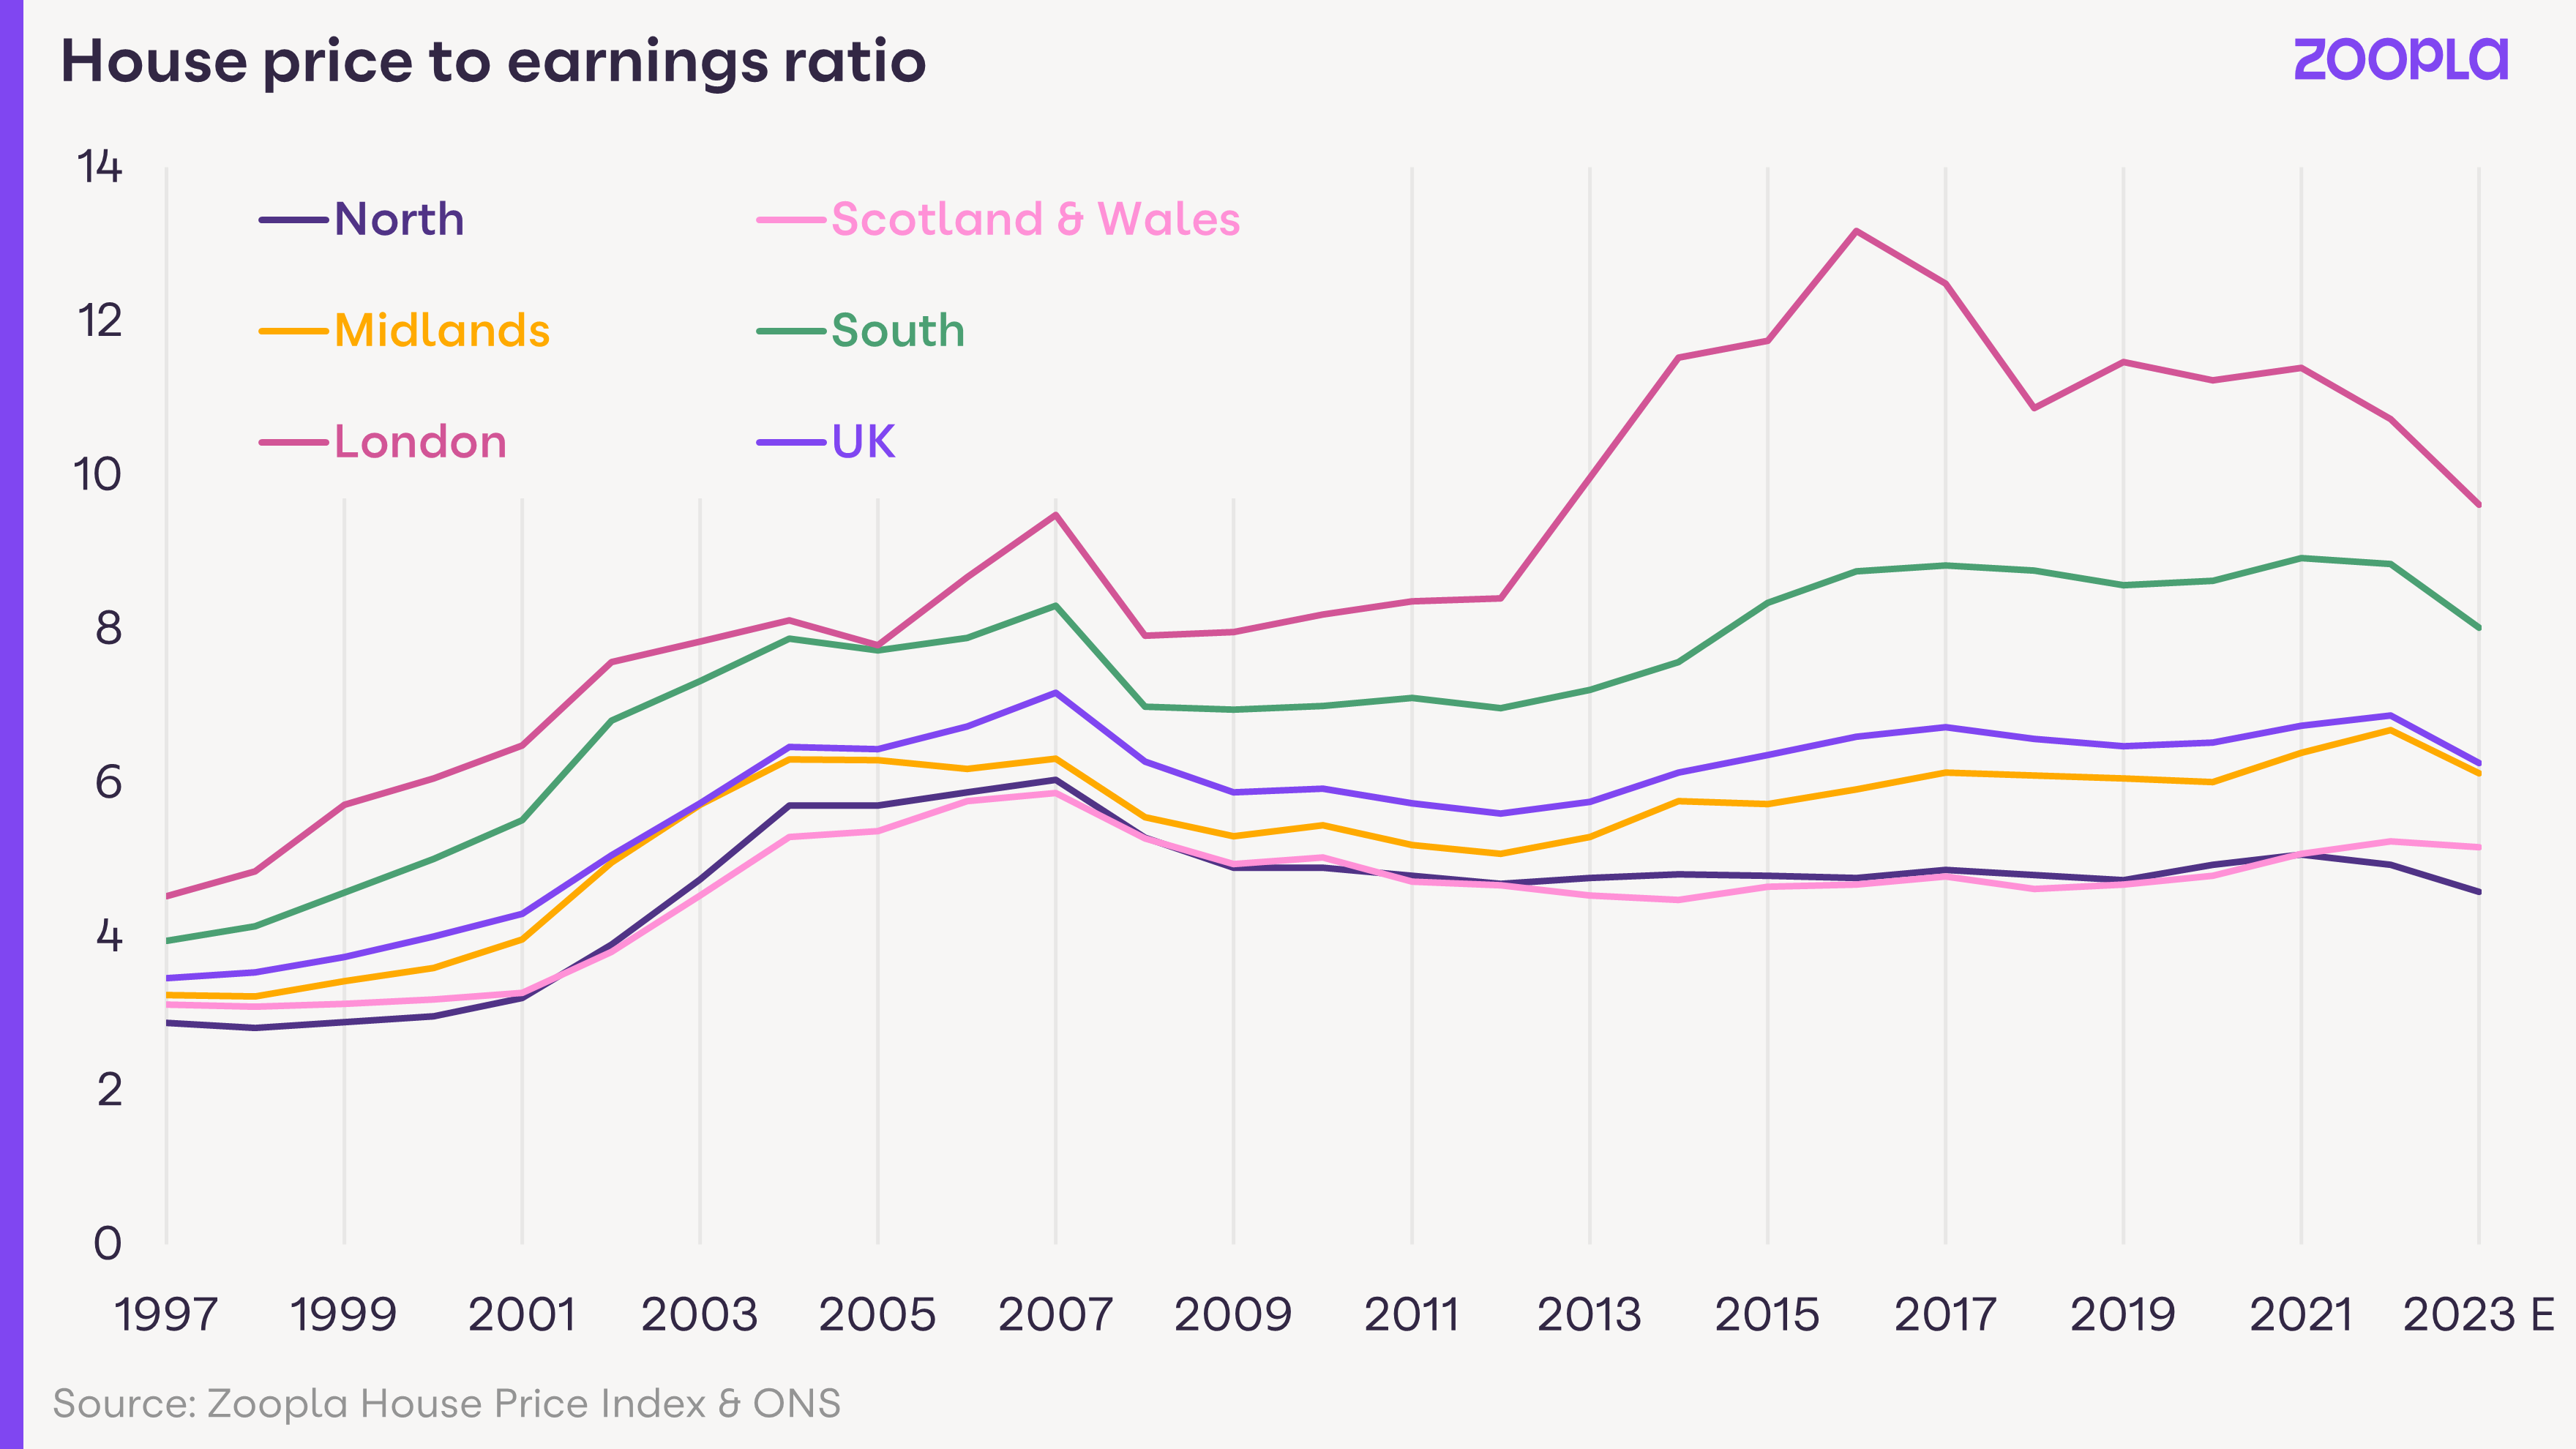
Affordability is improving relative to earnings as wages rise, up 7% over the last year. Housing affordability, on a house price to earnings basis, looks set to improve by 9-10% over 2023 as prices register modest falls and average earnings increase. The UK house price to earnings ratio will be in line with the 20-year average at the end of 2023 at 6.3x.
On a regional basis, affordability has improved the most in London. Here, the price to earnings ratio will get into single digits for the first time in 11 years as house price growth has been low since 2016.
We expect earnings to continue to rise faster than house prices again in 2024, improving the measure further, especially in southern England.
This, together with mortgage rates in the 4-5% range, will support sales volumes closer to the long-run average. Looking ahead, we remain more optimistic about sales volumes than house price growth. More flexible working, demographic trends from an ageing population, a strong labour market and high immigration will support movement and sales over the next 2-3 years.
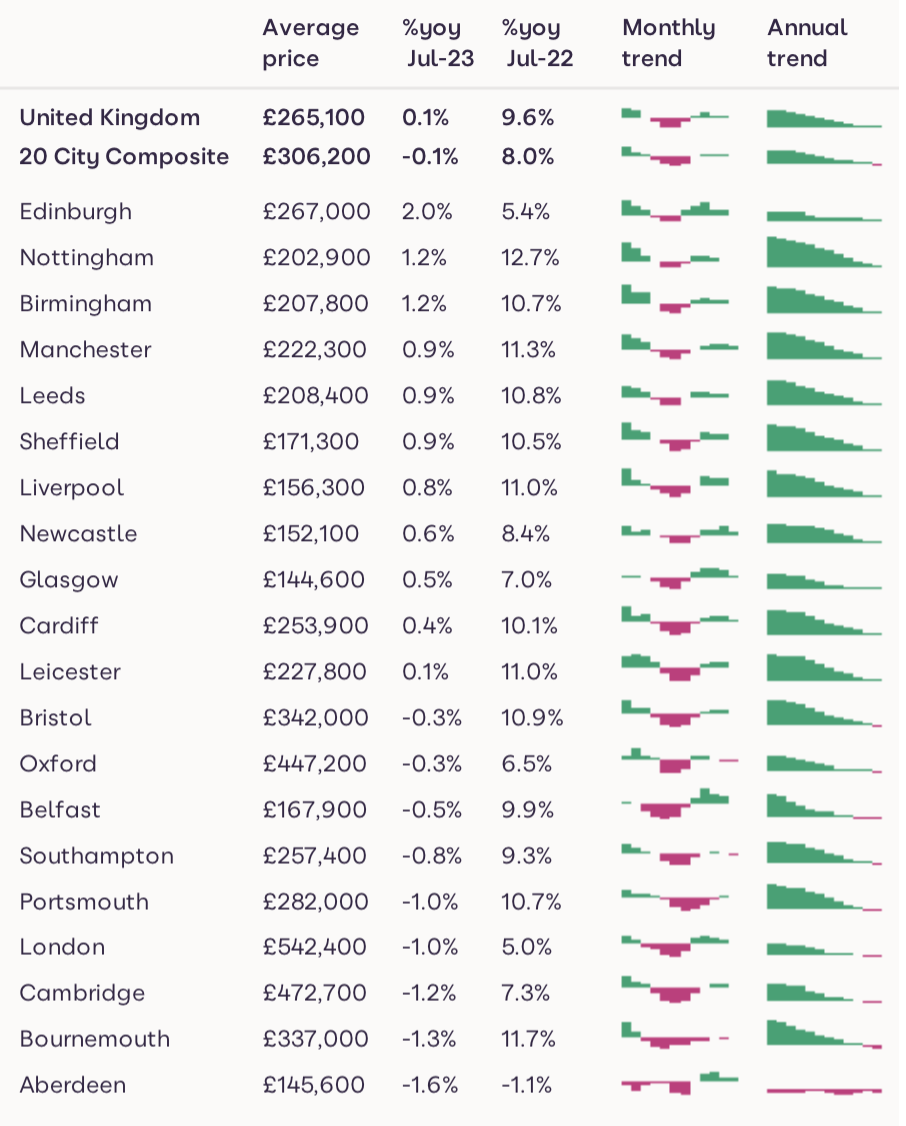
Note: The Zoopla house price index is a repeat sales-based price index, using sold prices, mortgage valuations and data for agreed sales. The index uses more input data than any other and is designed to accurately track the change in pricing for UK housing.

Source: Zoopla House Price Index. Sparklines show last 12 months trend in annual and monthly growth rates – red bars are a negative value – each series has its own axis settings providing a more granular view on price development.

UK house prices increase 1.6% as tariffs, stamp duty changes and broader economic uncertainty dampen buyer demand

House price inflation slows to 1.8% as the supply of homes for sale outpaces the growth in sales agreed
The housing market gets off to its strongest start in three years, with new sales agreed up 12 per cent on 2024.